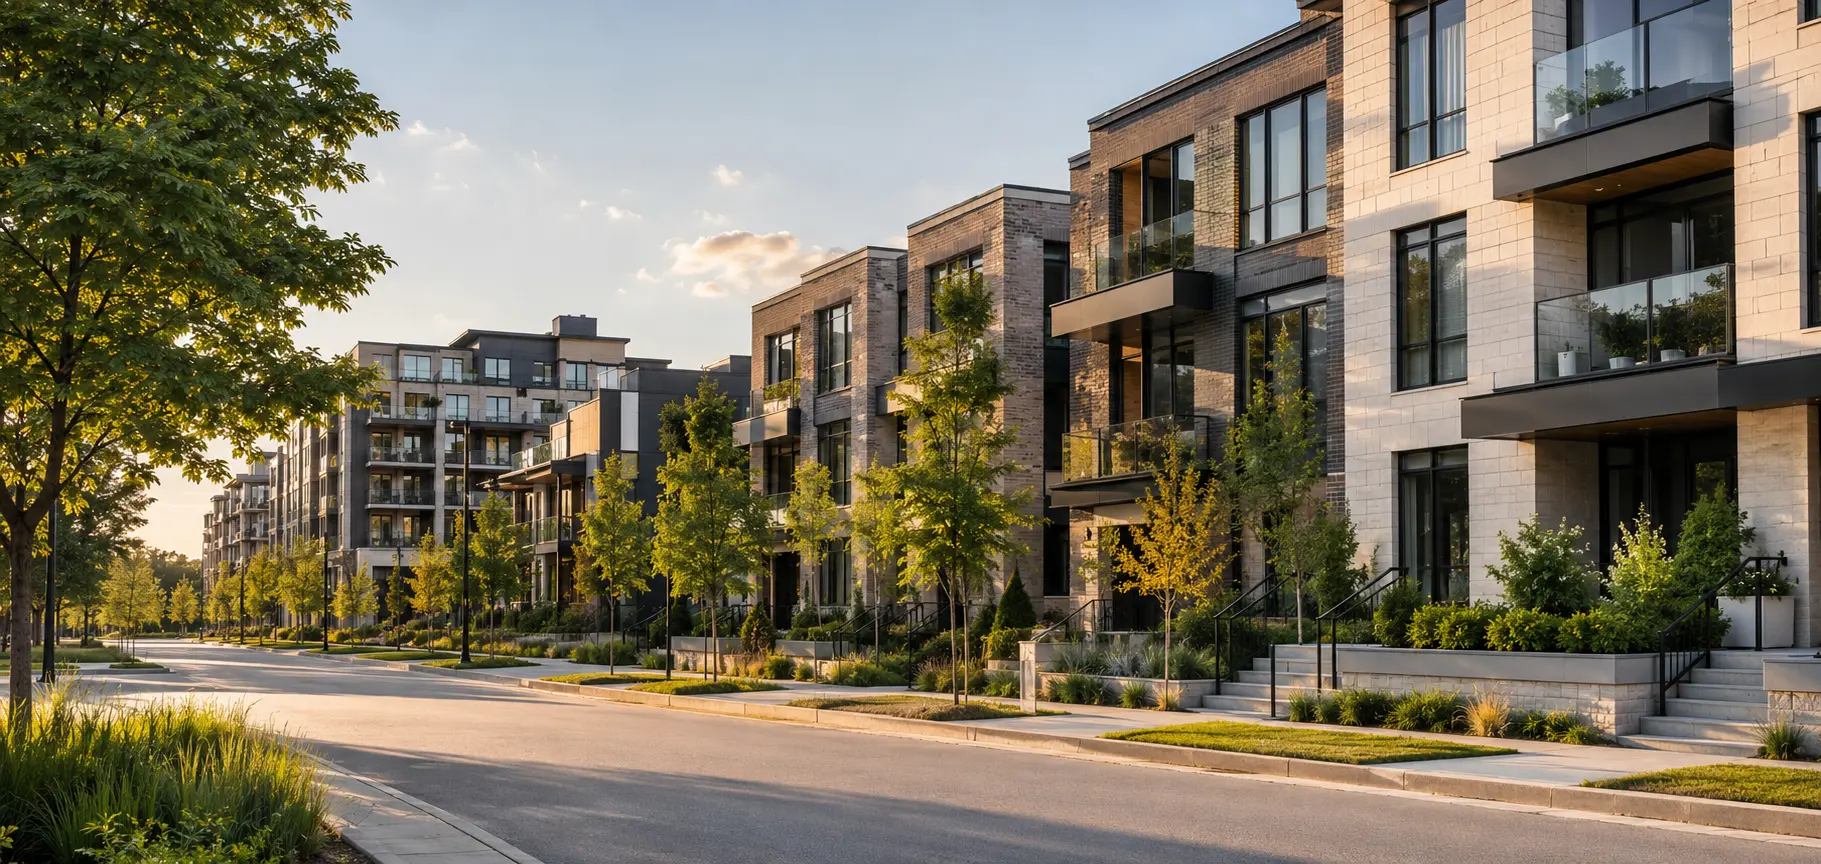
In August 2026, residential sales fell on Montreal’s South Shore while the number of available properties increased. The slowdown was especially visible in condos. Median prices, however, did not all move in the same direction.
Updated:
Key takeaways
- 664 August sales, down 15% from August 2025.
- 3,703 active listings : up 28% year over year.
- The figures describe the bulletin’s Montreal South Shore area, not individual cities.
The area covered by this review
This article uses page 8 of APCIQ’s August 2026 FSMI bulletin, labelled “Rive-Sud de Montréal.” The data comes from the Centris system. Monthly changes compare August 2026 with August 2025, not with July.
This table does not establish that Brossard, Longueuil or Chambly experienced exactly the same changes. The bulletin also reports Saint-Jean-sur-Richelieu separately on page 10. Local decisions require comparables from the relevant city and neighbourhood.
August: fewer sales, more supply
Montreal South Shore · August 2026Changes versus August 2025
- Sales
- 664−15%
- Active listings
- 3,703+28%
- New listings
- 1,281+17%
- Sales volume
- $440.6M−10%
Source: APCIQ through the Centris system, stats-202608-fr.pdf, p. 8. Active listings at month-end; volume rounded.
Regional figures cannot be attributed to each city individually.
See the detailed data table
| Indicator | August 2026 | Year-over-year |
|---|---|---|
| Sales | 664 | −15% |
| Active listings | 3,703 | +28% |
| New listings | 1,281 | +17% |
| Sales volume | $440.6M | −10% |
Does slower activity mean a buyer’s market?
Not by itself. Classifying a market also requires published conditions by property type, area and price band. The quarterly barometer provides this perspective, but its 12-month classifications are not a classification specifically for August.
The market-conditions table distinguishes buyer’s, balanced and seller’s segments. It complements sales and median prices without assigning one general label to the entire South Shore.
Houses, condos and plexes at a glance
Montreal South Shore · August 2026Changes versus August 2025
Single-family
- Sales
- 406 (−8%)
- Active listings
- 1,914 (+16%)
- Median price
- $655,000 (+4%)
- Average selling time
- 37 days (−4)
Condos
- Sales
- 210 (−26%)
- Active listings
- 1,475 (+43%)
- Median price
- $400,000 (0%)
- Average selling time
- 51 days (+7)
2–5-unit plexes
- Sales
- 48 (−11%)
- Active listings
- 300 (+44%)
- Median price
- $860,000 (+2%)
- Average selling time
- 51 days (−7)
Days · shared scale starting at zero (0–60)
Average time for properties sold during this period; not a promised selling time for a current listing.
Changes versus August 2025; selling-time changes are in days. These averages describe sold properties and do not guarantee how long a current listing will take to sell.
See the detailed data table
| Indicator | Single-family | Condos | 2–5-unit plexes |
|---|---|---|---|
| Sales | 406 (−8%) | 210 (−26%) | 48 (−11%) |
| Active listings | 1,914 (+16%) | 1,475 (+43%) | 300 (+44%) |
| Median price | $655,000 (+4%) | $400,000 (0%) | $860,000 (+2%) |
| Average selling time | 37 days (−4) | 51 days (+7) | 51 days (−7) |
What stands out by property type
- Houses : the median rose 4% despite fewer transactions. Average selling time fell to 37 days. A decline in sales does not automatically mean falling prices.
- Condos : sales fell 26% and active listings rose 43%. The median remained at $400,000, but average selling time increased. Buyers have more options to compare.
- Plexes : 48 transactions produced an $860,000 median. This segment has fewer sales than houses and condos, so the mix of buildings sold can have a greater effect on a single month’s figures.
January-to-August totals add perspective
The monthly 15% decline should not be described as the result for the entire year. From January through August, the area recorded 7,355 sales, down 4% from the same eight months in 2025.
For that year-to-date period, medians were $645,000 for houses (+3%), $405,000 for condos (+2%) and $815,000 for plexes (+7%). These figures cover January through August, not the trailing twelve months.
Has it become a buyer’s market?
The figures show more choice and a slower sales pace. On their own, they are not enough to label every segment a buyer’s market. APCIQ’s months-of-inventory measure uses a twelve-month sales pace to reduce seasonality.
Simply dividing 3,703 listings by 664 August sales does not reproduce that indicator. A condo facing several comparable listings must also be distinguished from a house with features that are scarce in its neighbourhood.
How to use the data for your plans
- Buyer : compare available properties and comparable sales, then shape an offer around condition, documents and your total budget.
- Seller : review price and presentation against current competition. A stable condo median does not guarantee a stable price for every unit.
- Buyer-seller : coordinate both transactions. The property you are selling and the one you want may belong to different market segments.
Add local Brossard–Saint-Lambert context
The second-quarter review provides a view of a smaller area. Keep its dates and boundaries in mind: a difference between an August regional median and a quarterly local median does not measure an increase or decrease in value.