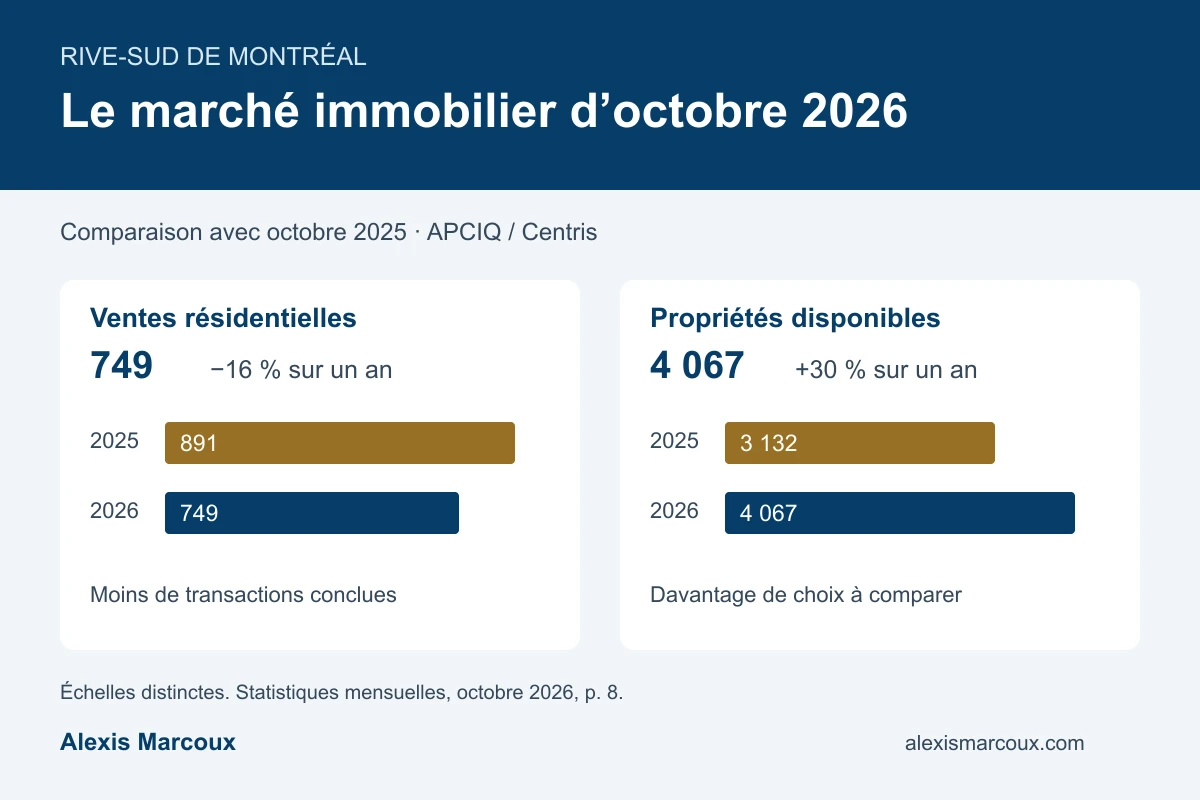
On Montreal’s South Shore, October 2026 brought fewer sales and more homes for sale than a year earlier. Yet median house, condo and plex prices edged higher. For your plans, the key is to understand where competition is changing, without treating slower sales as an automatic decline in your property’s value.
Key takeaways
- 749 sales, down 16% from October 2025; 4,067 active listings, up 30%.
- Condo sales fell 24%, with an average selling time of 49 days, versus 42 a year earlier.
- More choice can help buyers compare and negotiate, without guaranteeing a discount on every home.
Choice is growing without a surge in new listings
APCIQ’s monthly bulletin reports 749 October sales, compared with 891 a year earlier. Active listings rose from 3,132 to 4,067, while new listings edged down. Available inventory can therefore grow even when fewer properties enter the market: sales, withdrawals and expirations also affect what remains for sale.
My reading is that comparing properties is becoming more important. Sellers need to understand current competing listings as well as comparable sales. Buyers may have more options, but their usefulness still depends on neighbourhood, budget and building condition.
| Indicator | October 2026 | October 2025 | Year-over-year change |
|---|---|---|---|
| Sales | 749 | 891 | −16% |
| Active listings | 4,067 | 3,132 | +30% |
| New listings | 1,350 | 1,357 | −1% |
| Sales volume | $486.2M | $565.7M | −14% |
Source: APCIQ, Centris system, October 2026, p. 8. Changes versus October 2025. Selling times are averages for properties sold. The bulletin’s South Shore area does not describe each municipality individually.
Houses, condos and plexes: three different situations
Houses remain the most active segment by number of sales. Condos show the largest sales decline of the three categories and take longer to sell on average than houses. Plex supply has increased sharply, but there are fewer transactions, making medians and averages sensitive to the mix of buildings sold.
| Indicator | Houses | Condos | 2–5-unit plexes |
|---|---|---|---|
| Sales | 476 (−11%) | 219 (−24%) | 53 (−23%) |
| Active listings | 2,141 (+22%) | 1,572 (+39%) | 345 (+43%) |
| Median price | $629,000 (+1%) | $407,000 (+2%) | $810,000 (+5%) |
| Average selling time | 34 days (+3) | 49 days (+7) | 34 days (+4) |
Source: APCIQ, Centris system, October 2026, p. 8. Changes versus October 2025. Selling times are averages for properties sold. The bulletin’s South Shore area does not describe each municipality individually.
Sellers: refine your positioning without cutting blindly
More available listings mean looking at your property through the eyes of a buyer comparing several options. A regional median increase does not by itself justify raising your asking price. Conversely, fewer sales do not automatically call for a price cut. Recent truly comparable sales and listings targeting the same buyers matter most.
- Before listing : establish a range using comparable sales and review active competitors, their condition and inclusions.
- During the sale : track visits, feedback and competing listings; base adjustments on those signals rather than elapsed time alone.
- For a condo : prepare condominium documents and information on work and expenses to support an informed comparison.
Buyers: use the wider selection to make better decisions
Negotiating room needs to be assessed for a specific property: its price relative to comparables, condition, required work and actual competition. A well-positioned house may still attract several offers. A condo listed for longer is not necessarily a poor choice, but warrants questions about its price, documents and the reasons for selling.
- Compare several options and the total cost: purchase, financing, taxes, recurring expenses and foreseeable work.
- Keep transaction-appropriate safeguards, including inspection, financing and document review.
- Update your budget and pre-approval; avoid building an offer around an assumed future drop in rates or prices.
Greater Montreal provides context, not a local valuation
Across the Montreal CMA, the bulletin counts 3,252 sales (−18%) and 21,817 active listings (+18%). APCIQ describes easing conditions while noting that sellers generally retain an advantage. This does not establish a buyer’s market in every Brossard or Saint-Lambert segment.
The South Shore, Montérégie and Montreal Island are different areas. Detailed Brossard/Saint-Lambert figures on this site come from the Q3 barometer and retain that period. A monthly median describes the midpoint of recorded sale prices; it does not track changes in the value of the same house.
October, year-to-date and quarterly data: keep the periods clear
From January through October, the South Shore records 8,843 sales, down 5%. Year-to-date median prices are $643,000 for houses (+3%), $405,000 for condos (+2%) and $810,000 for plexes (+7%). These year-to-date medians should not be presented as October-only prices.
To assess the trend, start by comparing October with the previous October. Monthly charts retain earlier bulletin figures as published; revisions can explain differences from the latest cumulative total. Average selling times describe only properties sold during the period and do not guarantee how quickly a current listing will sell.
Buying and selling in the same market
If you need to sell before buying, assess both sides together. A more demanding sale negotiation may come with more purchase options, without the two effects necessarily cancelling out. I can help you compare a realistic selling price, properties that meet your needs and timing that works with your financing. The goal is a decision that fits your circumstances, not guessing the market’s next peak.